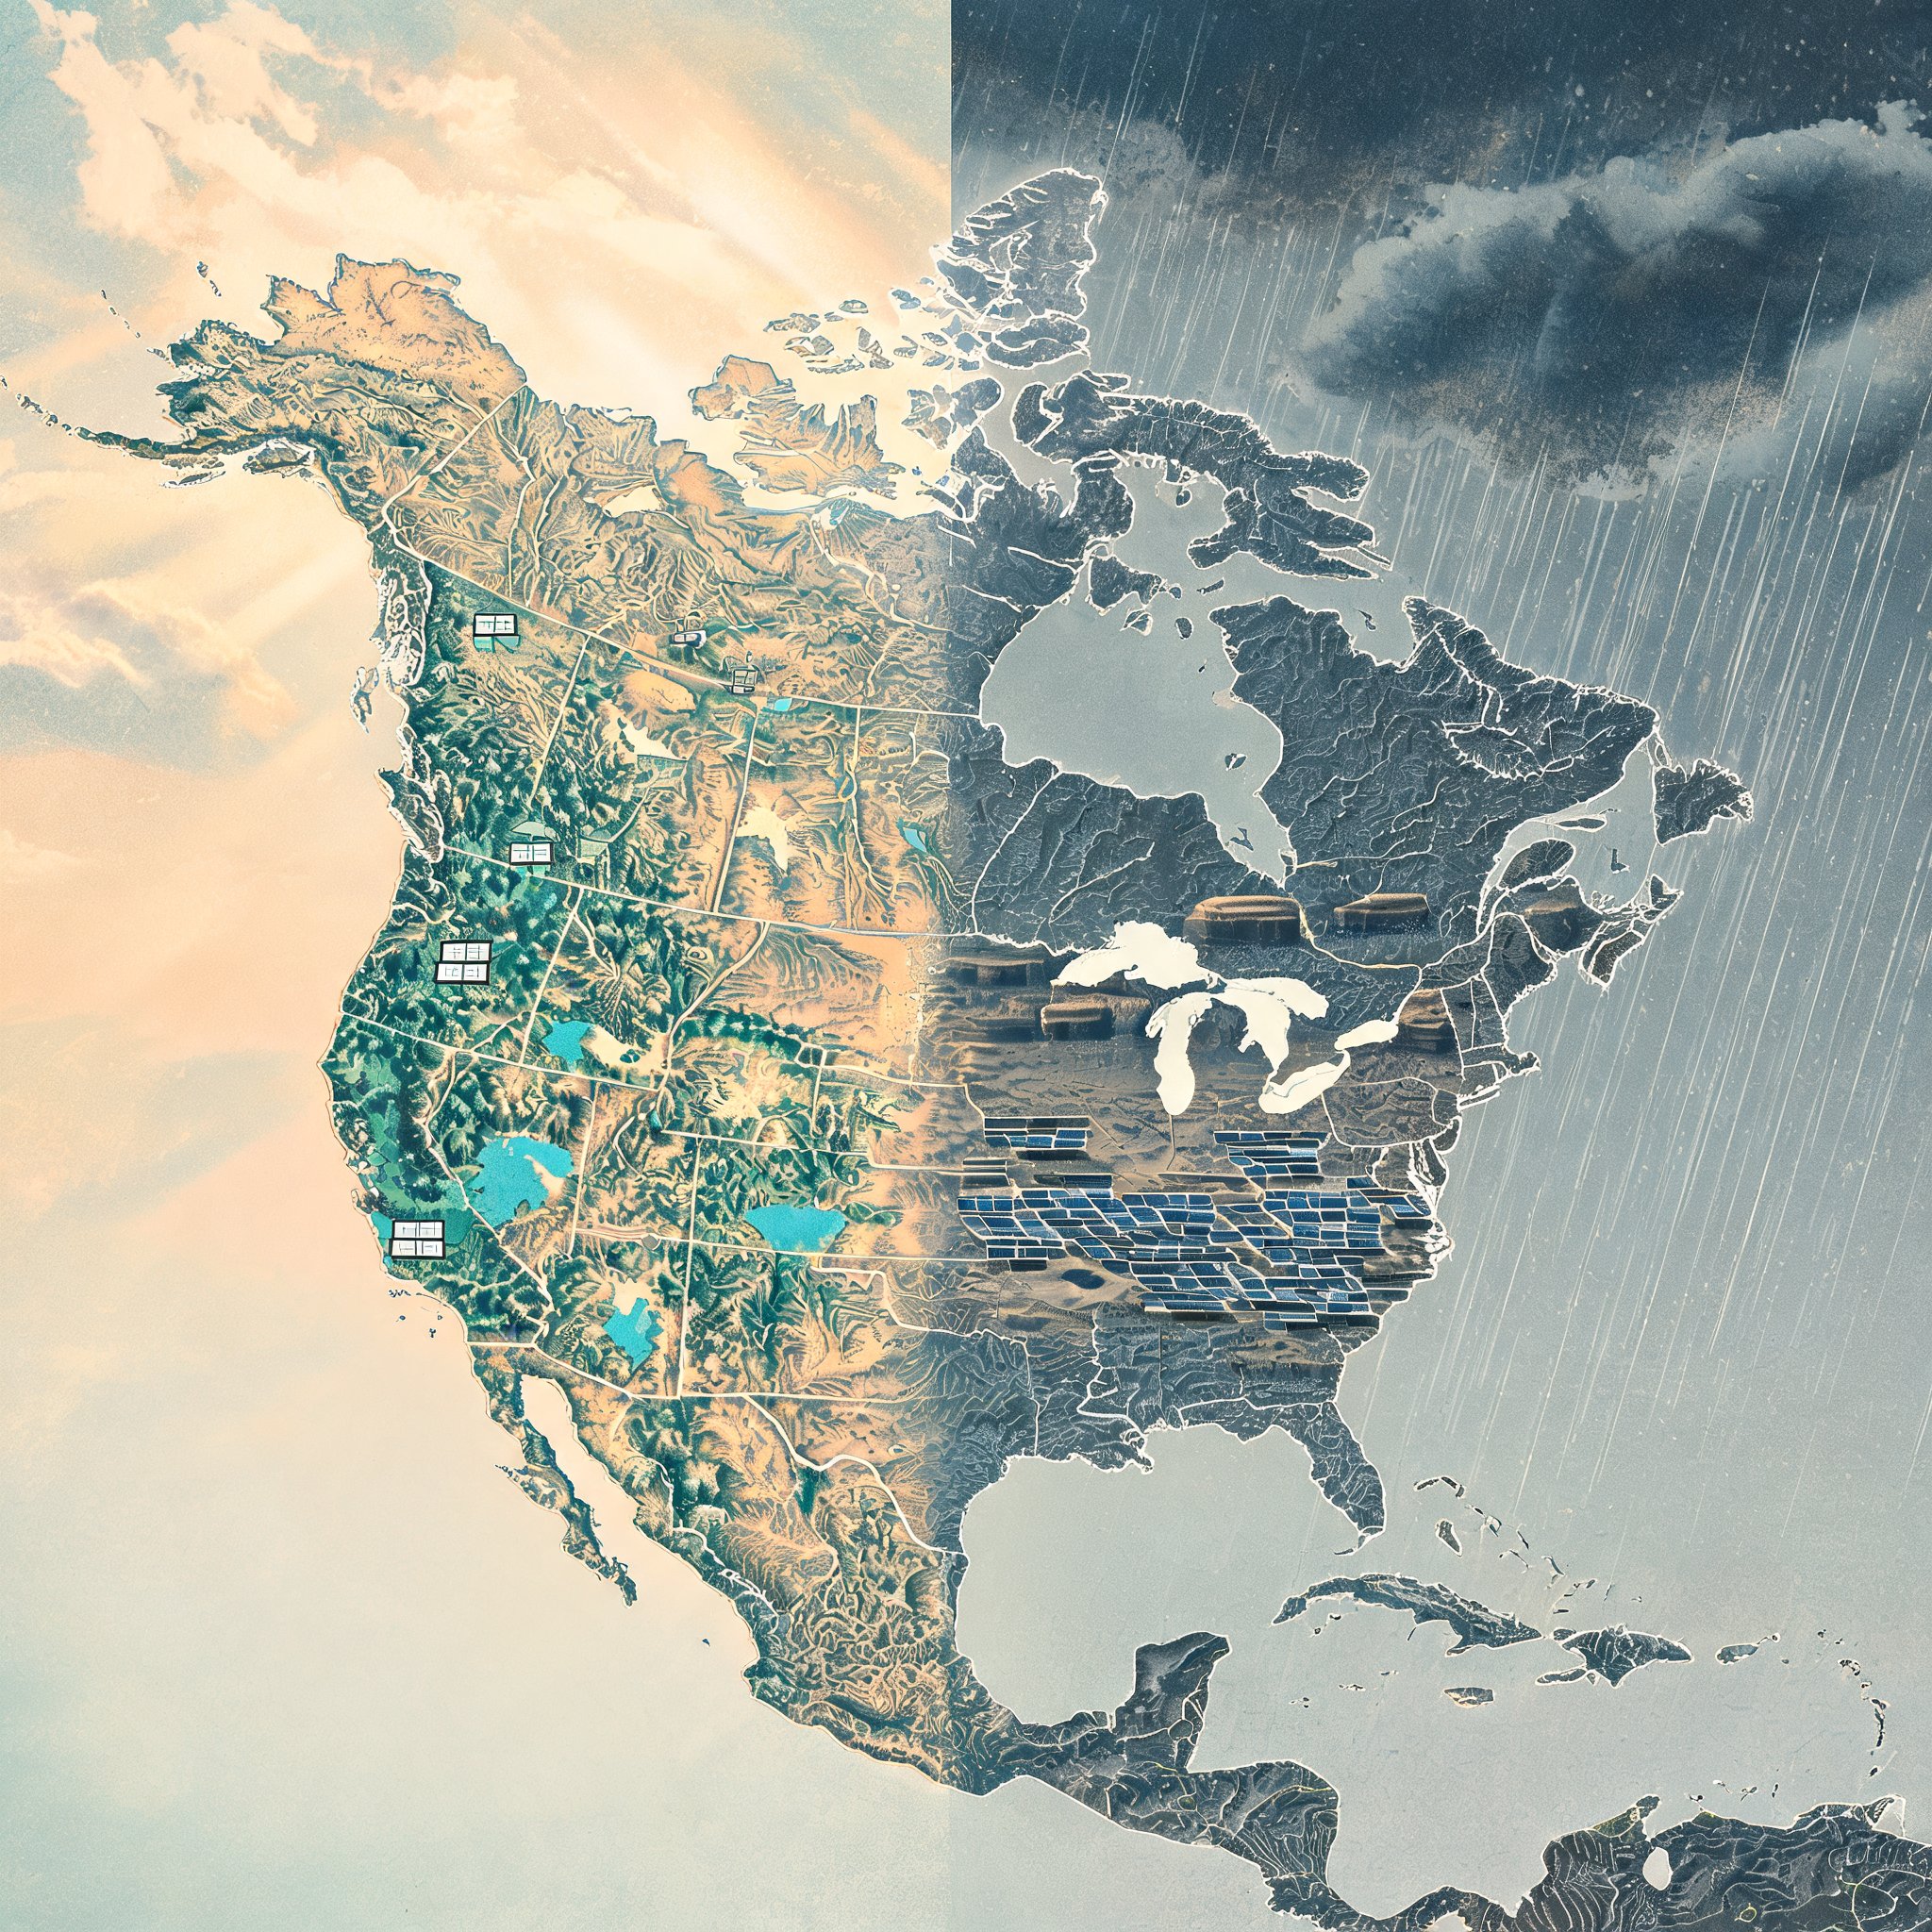
North American irradiance stayed close to normal in October 2026 when averaged across the continent, but that single figure masked sharply opposed conditions for solar assets. Global Horizontal Irradiance (GHI) came in 0.8% above normal for North America as a whole, according to an analysis using the Solcast API, with large surpluses in the Great Lakes and Northeast offset by widespread deficits in the Southwest and northern Mexico during an unusually wet month.
The Northeast and Great Lakes recorded October GHI averaging 14% above normal, and 95.5% of the region posted above-average irradiance. The strongest anomalies clustered around Upstate New York and parts of Michigan, where GHI ran roughly 20-25% above normal. Higher atmospheric pressure, lower humidity and below-normal precipitation across much of the region cut the frequency of cloudy periods, allowing more solar radiation to reach the surface. Buffalo registered its strongest October GHI in the 2007-2026 series, and Cleveland's average daily profile also set a high for the city within the Solcast record.
Those conditions mattered most in a region that hosts substantial distributed solar capacity, including in New York, New Jersey and Massachusetts.
A wet Southwest
Conditions reversed farther southwest. A strong low-pressure trough approaching the West Coast pulled Pacific moisture into the Four Corners area where Arizona, Colorado, New Mexico and Utah meet, and moisture linked to Tropical Storms Polo and Trudy added several days of heavy rainfall during October. The San Luis Valley took more than four times its usual October rainfall in four days, while the San Juan River at Pagosa Springs reached its second-highest crest since 1911.
Elevated atmospheric moisture spread across much of the Southwest and northern Mexico, increasing cloud cover and coinciding with a broad irradiance deficit. GHI across the region averaged 9% below the October norm. Phoenix came in about 10% below its 2007-2025 October average, making October 2026 its second-lowest October for GHI in the Solcast record.
The shortfall covered the solar-intensive corridor running from Southern California into Arizona, so a substantial concentration of utility-scale solar assets faced the same regional irradiance deficit at the same time. The analysis does not quantify what that meant for output from those plants.
What the split shows
Read together, the two regional figures show how far a continental statistic can sit from conditions at a given site. A 14% surplus in one area and a 9% deficit in another largely cancel out in the headline 0.8% number, while the resource actually reaching plants in each region moved in opposite directions over the same weeks.
The report treats October as a single assessment period and presents regional averages rather than site-level results, so individual arrays within the surplus and deficit zones would have seen conditions that differ from those averages.
How the figures are produced
Solcast derives the numbers by tracking clouds and aerosols at 1-2 km resolution worldwide, using satellite data together with proprietary AI and machine-learning algorithms. Those inputs drive irradiance models that calculate irradiance at high resolution with a typical bias of less than 2%, and also support cloud-tracking forecasts. The company says the data is used by more than 350 companies managing over 350 GW of solar assets globally.